[Post by Chuck Krugh, March 3, 2023]
Viz-boards are a wonderful visual tool; they easily communicate our current performance to you, me, an area or the company as a whole. They are designed so any person can look at the information displayed and see at a glance the status of our Safety, Quality, Schedule, Cost and People in a specific area. Yet, despite the significant value viz-boards bring in communicating what is happening, it is not enough information for us to fully manage a complex business like ours.
I wish we could use a small set of metrics to manage the company, but we make a complex product with many stages and many teams involved in the build. The viz-board provides a snapshot of the area it represents, but not a complete picture. For that, we need to include more metrics. Those additional metrics give us more details about what is happening and how well the area is performing.
Steering our business is an active process that requires ongoing change and adjustments. Having a dashboard helps us identify whether and when changes are necessary. Dealing with the facts – the data – helps us target changes where and when they need to be implemented.
While the viz-board is an actual board, the dashboard is a printed document that is usually compiled using Microsoft Excel. Included here is a sample image of what the high-level dashboard for our company could look like. It follows the same column structure as the viz-board, where each column is headed by Safety, Quality, Schedule, Cost or People in the same order. Key metrics for each category are placed under the most relevant header. Also, like the viz-boards, each metric is scored using the Red-Yellow-Green scheme. Green metrics are good. Red metrics require further investigation into root cause.
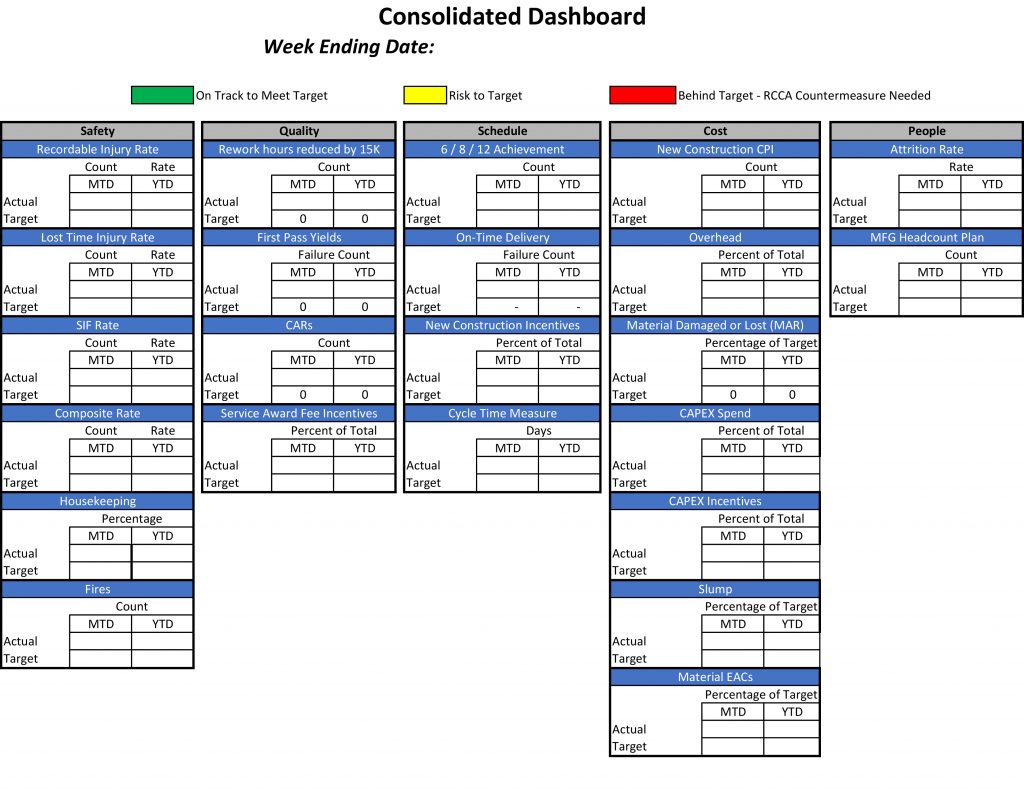
The dashboard is organized so you can scan down the columns and check all of the key metrics in each category. Although there is more data on this dashboard than the viz-board, you will still be able to tell, at a glance, whether we’re on track.
Just like our viz-boards, we will start with a dashboard for the point-of-execution level and roll that data up through each level of the company. Keeping the electronic version as a spreadsheet makes setting up the cascading relationships easier and more reliable because the software allows us to create rules for how the levels of data interact. We can apply formulas and formatting rules and define relationships between one dashboard level to another.
That way, when information shown on the point-of-execution boards rolls up to an area dashboard, the information will automatically be consolidated and weighted to show progress across the area in the different categories.
This dashboard is extremely flexible and agile. As the business adjusts and changes, so, too, can the dashboard. We may find that we are measuring something that isn’t really helping us manage the company better. Anything we choose to measure must contribute to improvements in managing the company. Measuring something just to measure is a waste of time!
Therefore, expect that the dashboards will change from time to time. Adding or subtracting metrics is not a bad thing as long as the ones we track are pertinent and meaningful.
Finally, like the viz-board, the dashboard communicates the health of the area/company. We can use this tool in an ad hoc meeting or in a monthly review. We don’t need to review a lot of slides when we have the dashboard because one page contains the data necessary to run the company. Very efficient!
When we’re in those meetings, we will acknowledge the good work driving those Green key performance indicators, or KPIs, but we will really focus on the Red metrics. We will make sure that we review the problem-solving and action plans that are underway to change the Reds to Greens!
I hope you can see why I like the use of this format in discussing our business. In the next blog, I will spend a little time breaking down the cascading dashboard logic. Until then, see you on the deckplates and remember, Safely Execute High-Quality Work!
Chuck
President, General Dynamics Bath Iron Works
Click here to view more From the Helm blog posts.